What a wild one in West London as Brentford edged past Manchester United in a pulsating 4-3 showdown in Matchweek 35. This match had everything: goals flying in from all angles, defensive chaos, and a frantic finish that left fans breathless. Brentford struck four times from an xG of 1.95, while United managed three goals from an xG of 1.37, highlighting just how clinical both sides were in a high-stakes contest.
Match Momentum: A Game of Swings
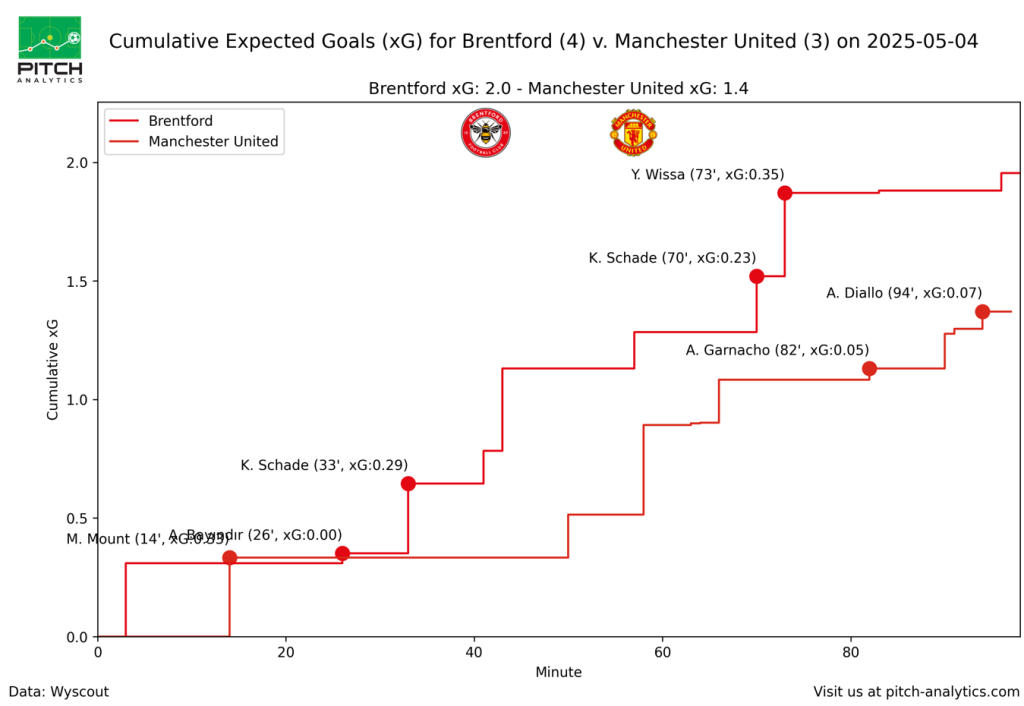
The match momentum chart shows a rollercoaster narrative. Manchester United had the early spark, with Mason Mount opening the scoring in the 14th minute. Brentford grew into the game and responded strongly, turning the tide midway through the first half as Kevin Schade carved out openings. The second half belonged to Brentford�s relentless pressing, culminating in goals from Schade in the 70th and Yoane Wissa in the 73rd. United clawed one back late through Alejandro Garnacho in the 82nd minute, but Brentford held firm despite a nervy final ten minutes.
Shots and Goals: Brentford�s Ruthless Finishing
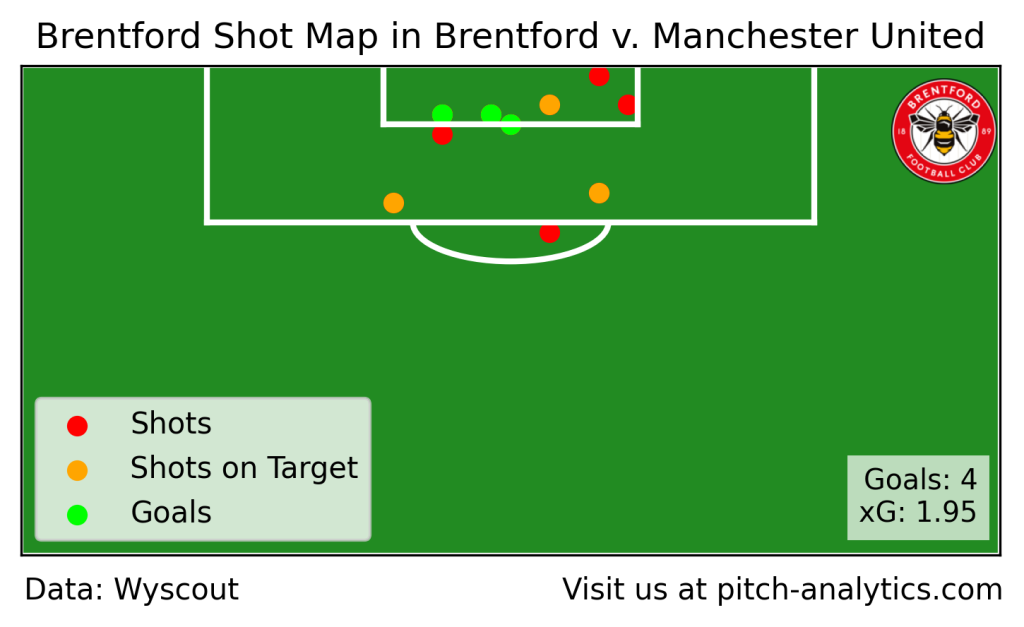
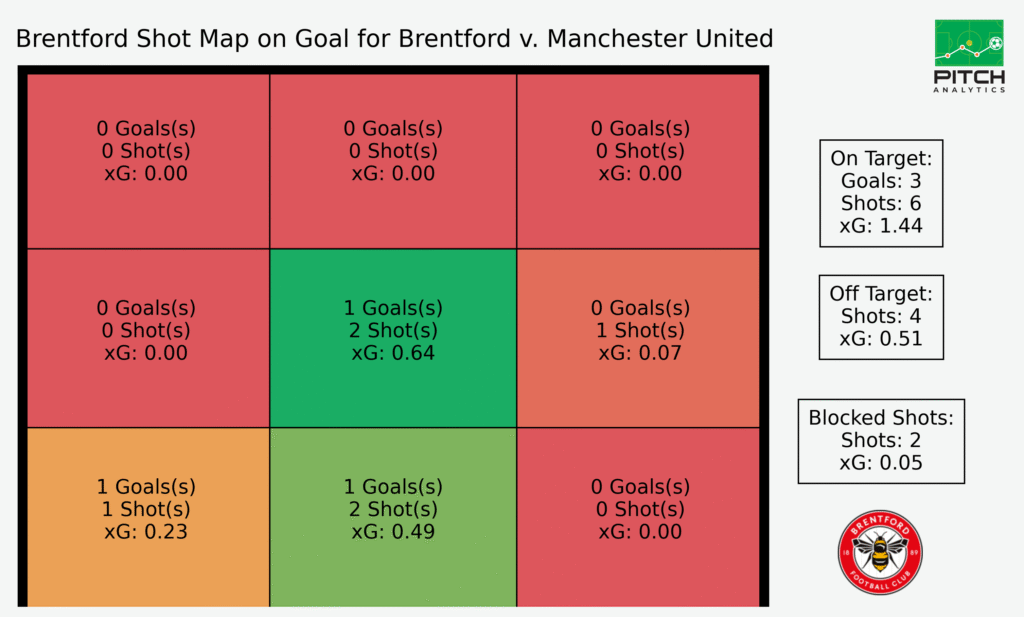
Brentford made the most of their opportunities with a perfect blend of precision and power. They scored four goals from just ten shots, firing six on target and showing a clinical edge that belied their modest shot tally. The Brentford shot map shows most of their shots clustered inside the penalty area, with three of the four goals coming from central zones close to goal. The shot map on goal data underscores Brentford�s efficiency, generating 1.44 xG from six shots on target compared to United�s 0.56 xG from four on target. Brentford�s finishing, particularly in those key central zones, was the difference maker.
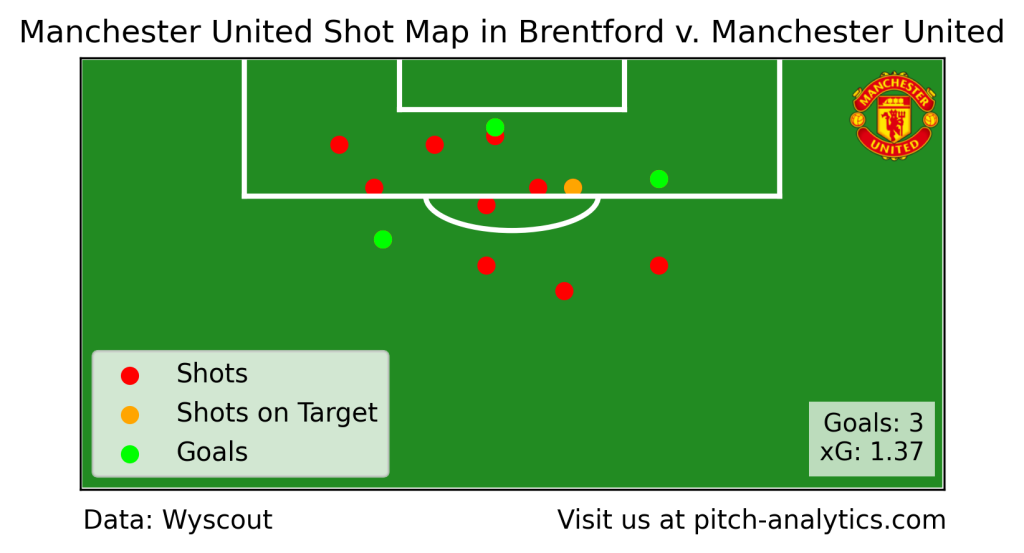
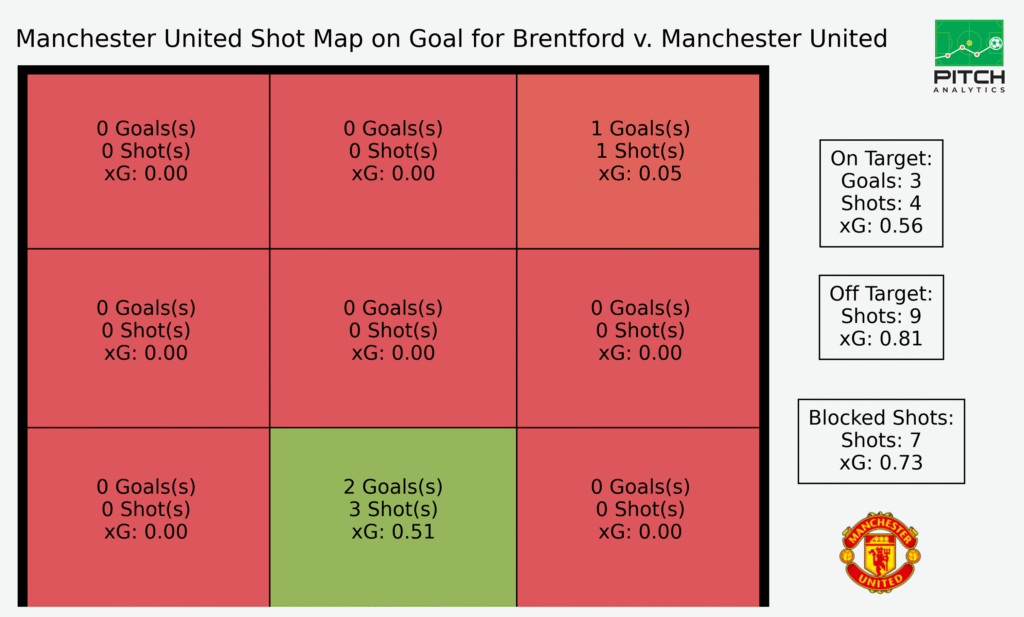
In contrast, Manchester United took 13 shots, hitting the target four times and scoring three goals. Their shot map reveals more efforts from outside the box and wider angles, with the best chance falling to Diallo deep into stoppage time.
In Possession: A Game of Margins
Possession stats were nearly split, with United shading it at 52 percent. United completed more passes and had slightly longer possession spells, averaging 16 seconds per possession compared to Brentford�s 15 seconds. However, Brentford made better use of their time on the ball, reaching the opponent�s box 15 times compared to United�s 13 despite having less possession overall. Brentford also enjoyed seven corners to United�s three, further emphasizing their ability to sustain attacking pressure in key moments.
Passing Patterns: Brentford�s Build-up vs United�s Progression
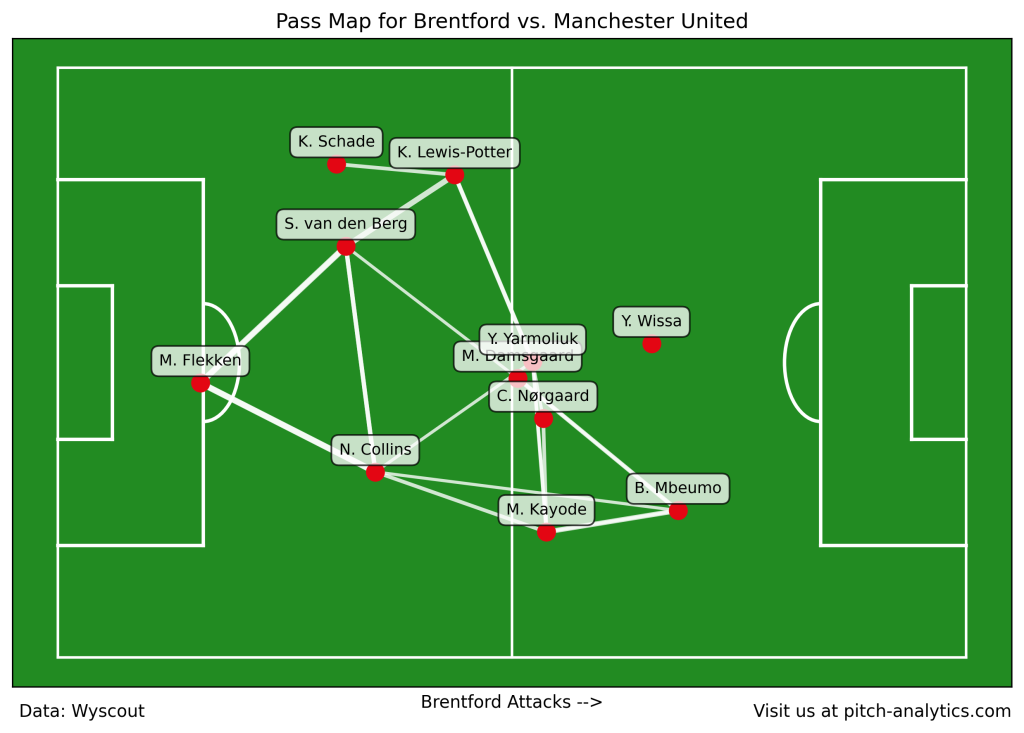
The pass maps tell the story of two very different approaches. Brentford�s passing network was concentrated through N�rgaard, Yarmoliuk, and Damsgaard pulling the strings in midfield, linking well with the wingbacks and creating triangles to progress up the flanks. Their buildup leaned heavily on getting the ball into wide areas before swinging it into dangerous central positions.
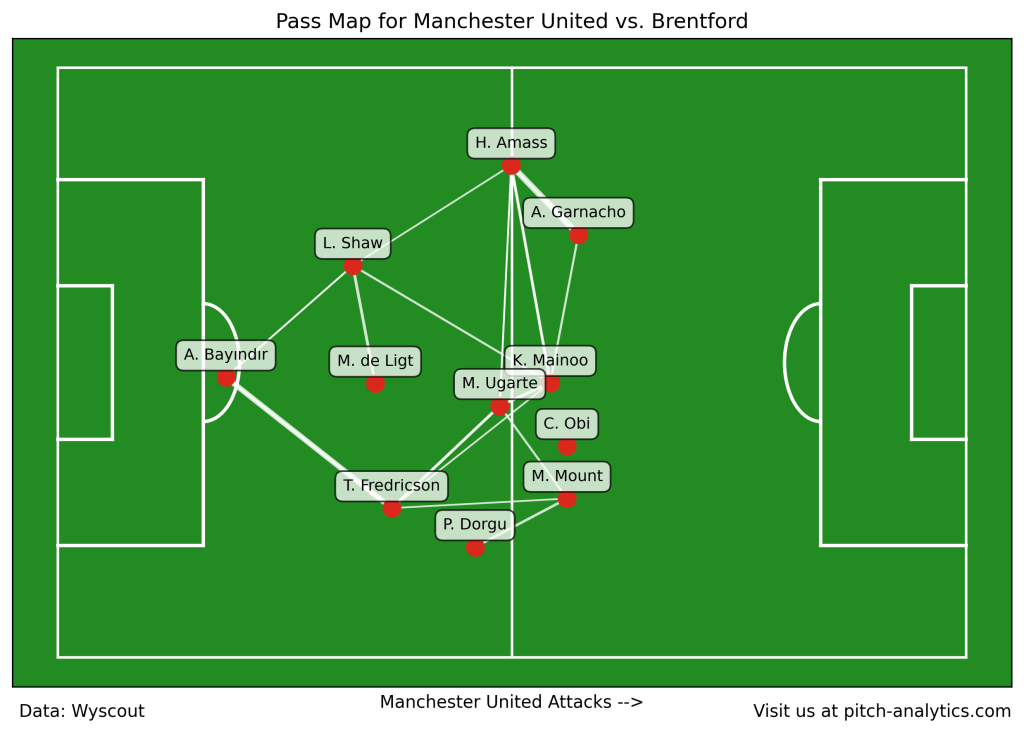
Manchester United, meanwhile, built from the back through Bayindir, De Ligt, and Fredricson, with Luke Shaw pushing forward to support the midfield. Kobbie Mainoo and Manuel Ugarte were key hubs in the center, recycling possession and trying to link with Amass and Garnacho on the left. Despite neat passing patterns, United at times lacked penetration through Brentford�s compact middle third, relying more on long switches and individual runs.
The Verdict
This match was a classic Premier League spectacle, combining frantic transitions, clinical finishing, and tactical adjustments on the fly. Brentford�s ability to punch above their xG and take their chances proved decisive in a game where Manchester United edged possession but couldn�t turn control into a result. With both teams still fighting for European spots, this result could prove pivotal as we enter the final stretch of the season.